Checkpoint facilitates shape anaysis for the tibia. The following explains how to create a tibia population and perform a shape analysis on that population.
- Define a procedure for placing landmarks on the tibia. Use single points, curves, and/or patches. Add primitives in the same order and orientation.
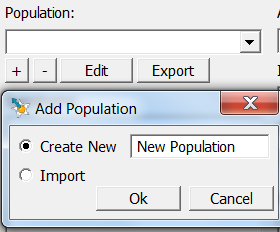
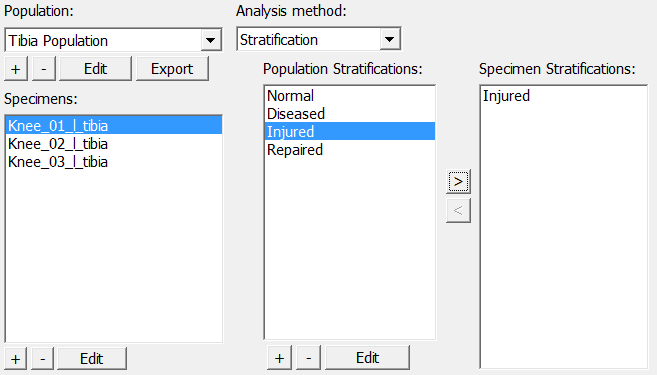
- Create a tibia population. In the “Shape Analysis” tab, click the “+” button under “Population” to create a new population. Enter a name for the population and click “Ok”.
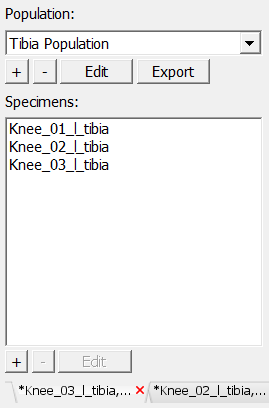
- Add the specimen to the tibia population. Click the “+” button under the “Specimens” list to add the currently selected scan’s primitives to the population. The red “X” next to the scan’s name marks the currently selected scan.
- Set the specimen’s stratification. Select the specimen then select a stratification from the list under “Population Stratifications” and click the “>” arrow to add the stratification to the specimen. If the desired stratification is unavailable, add it by clicking the “+” button under “Population Stratifications”.
- Apply a shape analysis to the population like calculating the average. Click on “Analyze” to perform the selected analysis.
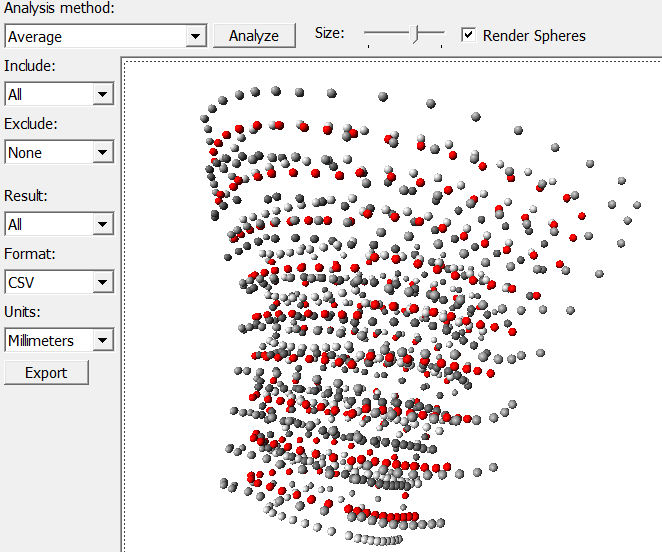
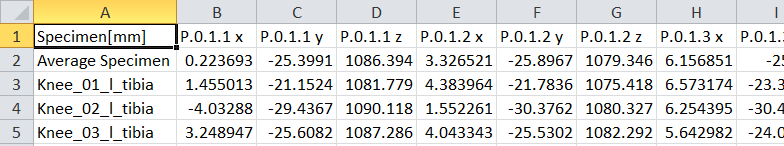
- Export the results to a CSV file. Select an option under “Result” and click the “Export” button. The exported specimens’ in the CSV file are separated by row. The first column holds the specimen’s name. The first row holds the population’s units and names for each point as well as indicating x, y, and z for each column.